A Landscape Analysis of School Building Leadership Preparation Programs in New York State
Abstract
In recent years, the landscape of K-12 educational leadership preparation has evolved nationally and in New York State (NYS). In this foundational landscape analysis report, our research team has identified institutions with currently active programs for school building leadership in the 2023-2024 academic year, collected relevant data about each, and analyzed tabulations to discern essential findings and implications for the field. Recommendations include important state and program policy shifts to ensure program sustainability, access, and quality over the coming decade, specifically related to credit requirements, adjunct/faculty ratios, instructional modalities, and DEI-related program content and recruiting efforts.
In recent years, the landscape of K-12 educational leadership preparation has evolved nationally and in New York State (NYS). There has been increased policy around program standards and topics of focus. As a representative group of faculty from leadership preparation programs, we set out to synthesize the influence of these shifting priorities and guidelines on higher education programs and their preparation of aspiring school leaders.
This research is made possible through the Diversity Leadership Initiative, supported by a grant from the New York State Education Department (NYSED) to Stony Brook University. The initiative’s aim has been to address the shortage of diverse and well-prepared K-12 school leaders throughout New York State. Facilitated by faculty from five universities, namely Stony Brook University, City College of New York, Fordham University, Hofstra University, and St. John’s University, this initiative is a collaborative effort to promote a diverse leadership pipeline. This leadership preparation program investigation provides a foundation for exploring further initiatives.
Table of Contents
- Research Focus
- Relevance and Context
- Research Methodology
- Research Findings
- Discussion of Findings: Trends and Patterns in SBL Leadership Preparation in NYS
- Patterns and Trends: Leadership Preparation in DEI Practices
- Implications and Recommendations
- References
- Appendix
Research Focus
We focused research efforts on school building leadership (SBL) preparation programs and omitted district leadership programs and doctoral programs with certification options. This targeted focus helps us understand and track changes as they relate to school leadership and its preparation, specifically. Three framing questions guided our research efforts:
- What is the current landscape of SBL preparation programs throughout NYS?
- How does program availability differ by region and public/private status?
- What is the nature of program content, structure, and delivery?
- How does this differ by region and institution type?
- How do programs prepare leaders for diversity, equity, and inclusion practices?
- How do these approaches differ by region and institution type?
Clearly, a secondary focus of our efforts was determining regional and institutional differences in SBL preparation. We know the field is rapidly changing, marked by the addition of new programs and the closing of old programs (Perrone & Tucker, 2019). As such, analyzing data by region helps us understand how priorities and policies have been implemented across the state to varying extents and how a college or university’s location may affect programming.
Relevance and Context
It’s an appropriate time to conduct this landscape analysis because policy shifts and trends in higher education have evolved in recent years, particularly since 2018. Various challenges and innovations in response to those shifts have been documented — yet to this point it has remained unclear how prevalent these might be among programs (Fuller & Young, 2022 and Steele et al., 2021). First, we set out to document major factors influencing SBL programs.
Major Factors Influencing SBL Programs in NYS, Noted By Scholars
New Requirements and Standards
- New state requirements for licensure (Koonce, 2009; Pavlakis & Kelley, 2016);
- Adoption of standards for leadership preparation and inclusion of internship requirements in most programs (Scott, 2018);
- NBPEA's revised standards: the Professional Standards for Educational Leaders (NBPEA, 2018);
- NBPEA's revised standards: the National Educational Leadership Preparation Program Recognition Standards (NBPEA, 2018).
Cost Concerns and Shifting Methods
- A heightened sense of competition and cost differences (Baum & Steele, 2018);
- Program cost viability impacting content and delivery (Baum & Steele, 2018);
- Demand for new methods for content delivery spurred by the pandemic, mainly online and hybrid formats.
Leader Prep for DEI Practices in Schools
- A stronger focus on diversity and equity, support for all students, and school improvement;
- An increased effort to diversify the leadership pipeline, including preparing and supporting aspiring leaders of color (Reyes-Guerra et al., 2022);
- The State's framework for promoting DEI: Culturally Responsive-Sustaining Education Framework (NYSED, 2018).
There has been an increased effort to prepare school leaders to implement diversity, equity, and inclusion (DEI) practices in schools. New York State leads in the area, taking great strides since 2018 to promote equitable practices in K-12 schools through its Culturally Responsive-Sustaining Education Framework (CR-SE), which promotes DEI values such as diversity as it pertains to race and ethnicity, language, gender, disability, and sexual orientation; inclusive learning; and reducing institutional racism and cultural bias. The framework is grounded in four principles:
- Creating a welcoming and affirming environment;
- Holding high expectations and delivering rigorous instruction;
- Building inclusive curriculum and assessment;
- Committing to ongoing professional learning.
State officials provided guidelines for how to implement this framework to school districts, but not to institutions of higher education. This report seeks to understand and document how this shift in policy, and the other major influencing factors listed, have impacted educational leadership preparation across the state.
Research Methodology
To conduct the landscape analysis, we broke our research effort into three phases: identifying programs, collecting data about them, and, lastly, transforming our data into findings. More specifically, we:
- Identified all New York State-approved and functioning leadership preparation programs;
- Collected data about each program in three buckets:
- Program content, structure, and delivery;
- Focus on diversity, equity, and inclusion practices in leader preparation;
- Number of graduates during the 2023–2024 academic year.
- Analyzed our tabulations for patterns and trends in the educational leadership preparation landscape in NYS.
Phase 1: Identifying Active SBL Programs
Our goal in phase one of research was to determine how many active SBL programs there currently are in New York State. To take this inventory, we first accessed NYSED’s "Inventory of Registered Programs" page, which listed 50 institutions with state-registered school leadership programs. To identify which of these programs are still in operation and which have closed, we researched the applicable university and department website from August 2023 to June 2024. Using this website information, we confirmed program statuses.
Phase 2: Collecting Data from Program Websites, Survey Results, and IPEDS
With a definitive inventory of institutions with active SBL programs in the state, we collected data about each program. We sought information on program content, structure, and delivery, the program’s focus on DEI practices for school leader preparation, and the number of program graduates during the 2023-2024 academic year. We conducted this data collection by:
- Reviewing university and department website pages;
- Fielding our Program Features Survey to program directors;
- Extracting data from IPEDS.
From program webpages, we collected and compiled details into a spreadsheet and converted it into a statewide program directory that includes: geographic location; presence of active SBL programs and programs that combined SBL preparation with school district leadership (SDL) preparation; contact information; URL address.
Fielding the Program Features Survey
To field a comprehensive and accessible survey targeted at the program directors of active SBL programs in NYS, we followed an intentional process. First, two group members drafted the survey, which is grounded in essential tools and philosophies:
- New York State's CR-SE Framework
- Professional Standards for Educational Leaders (PSELs)
- Five Practices for Equity-Focused School Leadership by Rabb, Generett, Good & Theoharis (2021)
Other team members, along with the NYS Chancellor, provided feedback to version one of the survey. Its authors integrated that feedback and shared version two with a broader pool of stakeholders — three professors from NYS educational leadership preparation programs in distinct regions and key state-level educational leaders. Survey authors then drafted the final version, and we distributed it via email to program directors during the Spring of 2024.
Program Features Survey Development Process
Note: Steps 4–5 may repeat until the survey is finalized.
1. INITIAL DEVELOPMENT
Two group members draft version 1 (v1) of the program features survey
↓
2. TEAM REVIEW
Team members and the NYS Chancellor review v1
↓
3. FEEDBACK INTEGRATION
Survey authors draft v2
↓
4. STAKEHOLDER REVIEW
Face-validity testing with 3 professors and key state-level personnel
↓
5. FEEDBACK INTEGRATION
Survey authors draft the final version
↓
FIELDING THE SURVEY
Shared with program directors, Spring 2024
We reached a 75% response rate using an email campaign with five reminders. From there, we contacted program directors directly and conducted interviews. Through these methods, we achieved a 97% response rate, with one program not responding. We removed a second program because the coordinator shared that their SBL program is embedded within a doctoral program and they did not provide information on their institution’s free-standing SBL program. Thus, we ended with 35 institutional responses to our survey.
Creating a Unique Dataset Using IPEDS
Using the Integrated Postsecondary Education Data System (IPEDS), we analyzed data on institutions with school building leadership programs in NYS that met the following criteria during the 2023-2024 academic year:
- Leads to postgraduate certificate or master's degree;
- Prepares candidates for the role of principal or other school building leader (rather than superintendent or other district leader);
- Falls within common titling conventions for these types of programs in its IPEDS categorization.
From this targeted pool of programs, we focused on two outcomes — number of program graduates and type of certificate or degree awarded. See Appendix A for data tabulation. We also uploaded this final dataset to our Statistical Package for the Social Sciences (SPSS) software and merged it with our survey results and website analysis data to meet the full scope of the project.
Phase 3: Transforming Data Into Findings
With so much data in hand from our processes of program identification, website culling and data organization, survey creation and fielding, and extraction of data from IPEDS, we turned our focus to the data itself. First, we combined the three disparate pools into one streamlined dataset by institution. Then, where there were inconsistencies, we relied on the survey responses for the most up-to-date information. We analyzed this singular, clean dataset using SPSS. The software generated descriptive statistics and cross-tabulations on program attributes and program delivery, organized by region, as well as sector of the institution running the program (i.e., institution type, whether public or private). Statistical differences were tested where relevant.
Through this analysis, we discovered that some institutions have several programs in educational leadership or offer the same program in different modalities. In this instance, our analysis assumes that survey responses adequately reflect all versions of an institution’s program, as we collected one survey per institution from its program director.
Research Findings
To determine the most helpful ways of diving into the data, we returned to the three questions framing our research. As a reminder, those are:
- What is the current landscape of SBL preparation programs throughout NYS?
- How does program availability differ by region and public/private status?
- What is the nature of program content, structure, and delivery?
- How does this differ by region and institution type?
- How do programs prepare leaders for diversity, equity, and inclusion practices?
- How do these approaches differ by region and institution type?
The Landscape of SBL Programs in NYS
Through our research process for taking inventory of active SBL programs, we determined that there are currently 37 in New York State. Thirteen of the 50 programs listed on NYSED’s "Inventory of Registered Programs" page have closed — a 26% decline in offerings across the state. Three institutions closed and ten institutions discontinued or put their SBL certification programs on hiatus. In terms of sector affiliation, 92% of closed institutions are private. No public institutions closed. The only public program to close was at CUNY Baruch. The large majority (69%) of closed programs were located in the New York metropolitan area. Our research confirmed the active status of each of the 37 programs — see Table 1 for details.
The thirteen institutions with programs listed in NYSED's "Inventory of Registered Programs" that are no longer active fall into two categories: the institution's program has shut down or the entire institution has closed. Those categories are as follows:
Closed Programs:
- CUNY Baruch College
- Iona University
- Manhattan University
- New York Institute of Technology
- New York University
- Pace University
- Relay Graduate School of Education
- Utica University
- University of Rochester
- Yeshiva University
Closed Institutions:
- Concordia College
- College of New Rochelle
- College of St. Rose
Per our first framing question, we dove into the regional distribution of these 37 programs.
Regional Distribution
Beyond creating this inventory, a second priority of the project is to map the geographic spread of these 37 institutions with programs to consider how regional differences may impact programming. As such, we sorted and classified the institutions with programs by the regions designated by the state. As that analysis shows, the institutions with programs are unevenly distributed across New York.
Over half (54%) of the institutions with programs are located in the New York metropolitan area among NYC, Long Island, and Lower Hudson Valley. By individual region, New York City has the most institutions with programs at 30%, followed by Western New York at 24%, Long Island at 16%, Central New York at 11%, and Upstate New York at 11%. The Lower Hudson Valley has the fewest institutions with programs at 8%. See Figure 1 for visualization.
Figure 1: Distribution of Active Educational Leadership Preparation Programs in NYS by Region
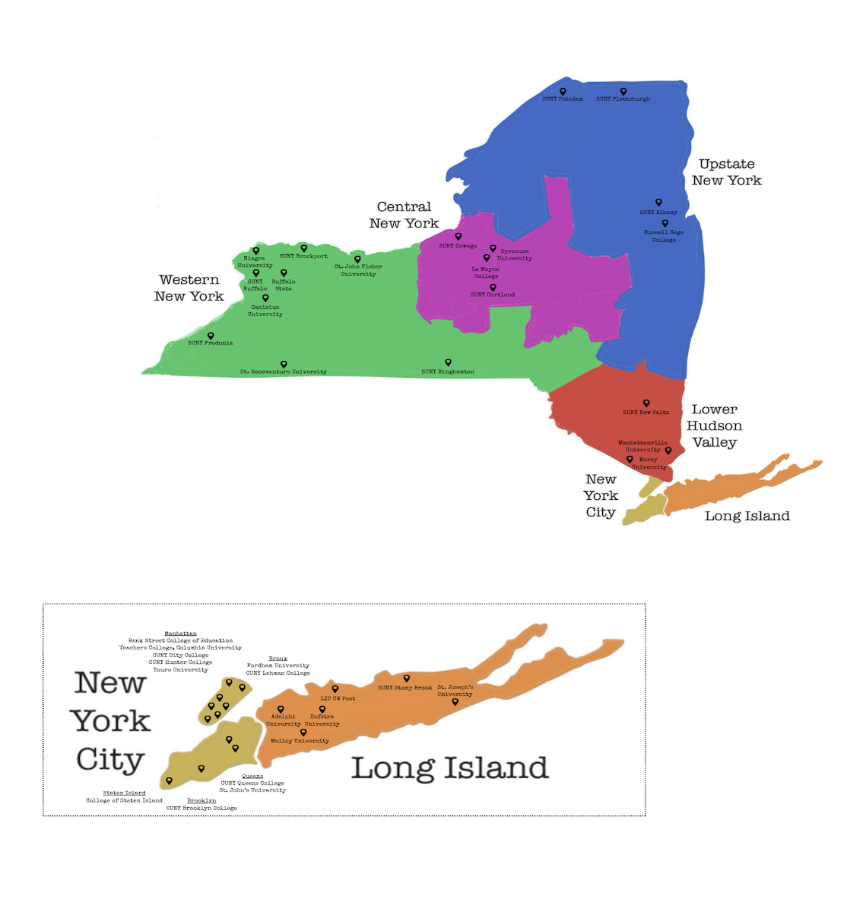
For a complete list of institutions by region, see the New York State Educational Leadership Program Directory or Appendix A.
Institution Type
The split between institution types is nearly even. Private institutions offer 51% of programs, while public institutions — State Universities of New York (SUNY) and City Universities of New York (CUNY) — offer the other 49% of programs. See Table 2 for details. (Note: Synchronous is abbreviated to Synch; Asynchronous to Asynch.)
Number of Graduates
The institutions’ programs varied widely in the number of graduates earning either a postgraduate certificate or a master's degree. This ranges from a low of zero to a high of 165 graduates in 2024, based on IPEDS reporting data. Table 3 shows the average number of program graduates by region and the total number of graduates by region in 2024.
The average number of graduates by institution is smallest in Upstate New York and Western New York (15 graduates) and largest on Long Island (67 graduates). The state averages 13 master's graduates and 23 postgraduate certificate graduates by program.
According to the IPEDS data, there were 1,140 educational leadership graduates statewide in 2024, 36% of whom earned a master's degree and 64% earned a postgraduate certificate (see Table 3). The total number of graduates varied widely by region, with 35% from Long Island institutions’ programs. The smallest number of graduates comes from the Lower Hudson Valley and Upstate New York. These figures represent the location of the institution, not the graduate — as several institutions offer online programs, that may skew counting. Similarly, some programs partner with districts in other parts of the state, possibly skewing how graduates are counted by region, as well.
We also analyzed the number of graduates by institution type, as shown in Table 4. Private institutions average significantly more graduates per program (41) than public institutions (31). Combined, 56% of all graduates earned their degree or certificate from a private institution, half of whom earned a master’s degree.
After compiling data on the 37 active SBL programs, their regional distribution, and institution type, and crafting tabulations on various program attributes, we can see a much clearer picture of the landscape of SBL programming in the state. We continued to dive into the data to better understand the nature of program content, structure, and delivery and how they differ among regions.
The Nature of Program Content, Structure, and Delivery
To address our second framing question, we organized data into three categories and analyzed them by institution type (i.e., public or private) and looked at regional differences among them. Those categories are:
- Content — academic focus, i.e., SBL vs. SBL/SDL combined
- Structure — credentialing pathways; number of credits; program cost
- Delivery — instructional modality; nature of faculty (i.e., full-time or adjunct)
What follows is our dataset looked at in different ways in varying combinations from these categories and subcategories, extracted from our numbers relevant to the 2023-2024 academic year. This set of tabulations aid our understanding of the nature of educational leadership preparation programs in NYS and implications thereof.
Program Content: Academic Focus on SBL or SBL/SDL Combined
To organize our data on program content, we looked at the academic focus of offerings across the state for educational leadership preparation. Specifically, we analyzed data on SBL programs versus SBL/SDL combination programs. According to our survey results, we found that the minority of institutions in the state — only 37% — offer SBL-only certificate programs (detailed in Table 2). The majority of institutions (63%) offer a combined SBL/SDL program. The percentages in Table 5 show that, overall, a dual certification pathway is most common, and that it’s less accessible to obtain SDL certification in Upstate New York than in other regions of the state.
We also analyzed data on academic focus by institution type and found that private institutions are more likely to offer combined SBL/SDL certification programs (63%) than public institutions (56%). See Table 6 for this data and more data points about academic focus, credentialing pathways, and instructional modalities by institution type.
Through researching educational leadership preparation program options in the state, namely academic focus and its prevalence in different regions and across institution types, we’re able to map the landscape of SBL and SBL/SDL programs.
Program Structure: Credentialing Pathways; Numbers of Credits; Cost
Diving into program structure, we analyzed our dataset related to credentialing pathways — whether a prospective student has a choice to pursue a postgraduate certificate program, a master’s program, or either in their region (see Table 3) — and averages among number of credits and tuition costs per program across region and institution type. We also wove in data points on selected student demographic markers, such as numbers of graduates identifying as female; separately, graduates identifying as white; separately, graduates residing in urban settings.
The distribution of credentialing pathways varies by region. In Central New York, all programs lead to a postgraduate certificate; there are no pathways to a master’s degree. Similarly, the majority of programs in Upstate New York and Long Island — 75% and 67%, respectively — lead solely to a postgraduate certificate. In contrast, half of all programs in New York City lead to a master’s degree only, 10% to a certificate only, and 40% to both. All programs in the Lower Hudson Valley lead to both a master’s degree and a certificate option. Regarding institution type as it relates to credentialing pathways, we found that private institutions are morelikely than public institutions to offer both credentialing pathway options. Public institutions are more likely to offer a certificate pathway only (see Table 6).
Across the state, the average number of required credits is about 31, but ranges widely
from 22 to 36 credits (see Table 7). This range masks wide variations among the programs: five require 22-26 credits,
while seven require 35-36 credits. The variation is unrelated to whether the focus
of a program is SBL or SBL/SDL. By region and by institution type, the average number
of required credits varies somewhat. By region, the average number of required credits
is lowest in programs on Long Island, at 29 credits, and highest in programs in Upstate
New York, at nearly 33 credits. By institution type, we found a statistically significant
difference between the average number of required credits at public and private institutions.
Public institutions require more credits on average (32.6) than private institutions
(29.2) credits (see Table 7).
Clearly, credit requirements pair with tuition costs in our data points. Analyzing relevant data related to program cost, we found wide variation among programs and regions. The average cost per course credit among programs is $725 — ranging from a low of $430 to a high of $1,868. The average per credit tuition rate varies by region from a high of $915 per credit on Long Island to a low of $517 in Upstate New York (see Table 7). These regional differences reflect, in part, the prevalence of public and private institutions across regions. Private institutions' average per credit tuition is almost twice that of public institutions: $991 vs. $509 (see Table 8).
We found that the average total tuition (credits × tuition) among these programs is $22,238. The range is wide, with a low of $11,280 to a high of $56,040. Regional differences largely account for this range: Lower Hudson Valley and Long Island have the highest average total tuition; Central and Upstate New York have the lowest. By institution type, we found that the cost of average total tuition is significantly higher at private institutions than at public institutions: $29,079 versus $16,498 (see Table 8).
| Program Attributes | Institution Type | Average | |
|---|---|---|---|
| Public | Private | ||
| Average Number of Credits | 32.59 | 29.17 | 30.83 |
| Tuition Cost per Credit | $509.13 | $991.15 | $725.21 |
| Total Program Cost | $16,498.81 | $29,079.62 | $22,138.48 |
*p<.01
We addressed program structure by analyzing data points on credentialing pathways, number of credits, and program costs by region and institution type. These tabulations help us see differences across the state in pathways and costs to better understand the landscape of educational leadership preparation in the state.
Program Delivery: Instructional Modalities and Nature of Faculty
To analyze differences among program delivery, we looked at data points in instructional modalities and nature of faculty (i.e., full-time vs. adjunct). We crafted tabulations by institution type and by region and looked at data points on selected student demographic markers, as in the other categories, but also looked at various program attributes by instructional modalities.
Staffing in programs varied widely among the institutions with an average of 2.7 tenure/tenure
track and clinical faculty, ranging from zero to ten. Public institutions have a higher
average number of faculty than private institutions (3.14 vs. 2.36). There are strong
regional differences, too. Programs on Long Island and in Western New York have fewer
faculty on average (1.33 to 1.44), while institutions in NYC and Upstate New York
averaged almost three times the faculty members (4.0 to 4.3). In contrast, the average
number of adjuncts across all institutions’ programs is 10.4, with a wide range from
zero to 78. There was no difference between the averages for public and private institutions
in the number of adjuncts used (see Table 8), but this varies widely by region. Lower
Hudson Valley has a low average of five adjuncts while Long Island has a high of 21
(see Table 9).
*p<.01
Looking at data on instructional modality, we found that there are four general ways programs deliver instruction: in a hybrid setting, with some in-person time and some online time; asynchronous only, with no in-person time and no specific meeting time online; synchronous and asynchronous, with some meeting time online and other individual work time online; and a combination of all of these.
None of the institutions offer a fully in-person program. Twenty-one percent offer hybrid only; 51% offer online only, including 18% asynchronous only and 33% synchronous and asynchronous. The remaining 27% offer their programs through multiple modalities (e.g., a hybrid program and an online program). There are some regional differences: programs on Long Island and in Western New York are online only, while all the Lower Hudson Valley programs include hybrid options. Public institutions are more likely to offer multiple instructional modalities (40% vs. 20%) than their private counterparts and as likely to offer a hybrid option (20%) (see Table 6.) We continued looking at data by instructional modality across various program attributes to map differences among delivery methods.
Relationships and Patterns Among Attributes in Program Content, Structure, and Delivery
Exploring several relationships among program attributes, we found some patterns.
We correlated the number of credits, tuition per credit, number of faculty and adjuncts,
number of graduates, and percentage of students who are female or white (data not
shown). There was no significant relationship among these, with the exception that
the number of program graduates is significantly and positively related to the number
of program adjuncts (r=+.807) and average tuition per credit (r=+.389).
There were discernible differences by modality, however (see Table 10). On average, asynchronous only programs are somewhat shorter than programs in other modalities, have the lowest tuition per credit, and have the lowest percentage of students who are female (63%). Online programs (combining synchronous and asynchronous modalities) have the highest average tuition per credit, number of adjunct faculty, percent of students who are female, and the largest average number of graduates.
The Landscape of Leader Preparation in DEI Practices
Our final category of inquiry was related to institutions’ preparation of aspiring school leaders’ competence and capacity to implement diversity, equity, and inclusion (DEI) practices in schools. We used results from our Program Features Survey to create tabulations related to where and how DEI practices are woven into SBL programming across the state. Specifically, we explored whether, during the 2023-2024 academic year, programs had:
- A dedicated course on DEI content and practices;
- DEI instructional content and learning activities;
- Generally inclusive practices for marginalized groups, such as ELLs or LGBTQ+ groups;
- Alignment with the PSEL standards and CR-SE framework;
- Intentional recruitment practices from diverse groups.
Dedicated Course
Our survey findings show that 32% of institutions’ programs have a dedicated DEI or social justice course, with regional variation. Over half the programs in Central, Western, and Upstate New York require a dedicated DEI or social justice course; no programs on Long Island do. Looking at institution type, private institutions’ programs are significantly more likely to have this type of course requirement than are programs in public institutions (39% vs. 25%). Sample titles of DEI-focused courses include:
- Reading for Equity and Social Justice
- Leading for Excellence: Educational Equity, Diversity, and Inclusion
- Culturally Responsive Leadership
Note: Percentages indicate the proportion of institutions within each region that have a program with a dedicated DEI course. Curriculum indicators reflect the average number of DEI-related measures integrated into the institutions’ programs.>
Almost all program directors (89%) indicated that DEI was integrated either moderately or extensively across all coursework (see Table 11). In open-ended questions, some program directors shared that in their institutions, DEI-focused curricula occur throughout their coursework, rather than being situated in a particular course. For example, one program director explained that DEI-related content was the focus of a special education course but was also woven throughout other coursework. While some institutions do dedicate a course to DEI-related learning, clearly some intertwine it throughout coursework.
Quotes from Program Directors on
DEI Integration into Coursework
- “[W]eave [it] intentionally throughout the program and internships.”
- “We weave DEI research and anti-racist leadership practices into each course. We use the text, Five Practices for Equity Focused School Leadership, over several of our beginning courses.”
Instructional Content and Learning Activities
We explored how and to what extent institutions had programs that focused on skills development to help aspiring leaders enter schools with competence in DEI practices. Using a 5-point scale — 1 being “not at all true”; 5 being “to a great extent” — program directors rated the extent to which their institutions’ programs covered 11 different DEI-related content and experiences for the typical student in their SBL certification program. Generally, they rated their programs highly in the areas of developing students’ capacity to strive for equity (4.9) and developing staff’s cultural competence (4.84). In fact, 91% of coordinators shared that their programs developed students' capacity to strive for equity to a great extent. Around 83% of directors reported assessing DEI content either moderately (34%) or to a great extent (49%) (See Table 12).
In Table 11, we averaged these 11 DEI-related possible student experiences to give each region and institution type its own score on the extent to which DEI indicators appear in programs therein. Those results show an “average extent of DEI indicators” score of 4.2 — between “moderate” and “to a great extent” — among the 11 indicators. The range is 2.9 to 5, influenced somewhat by region, with a low in Western New York (3.8, or, “somewhat”) to a high in Lower Hudson Valley (4.8, or, nearly “to a great extent”). There was little difference in the average number of indicators between public and private institutions.
Some program directors shared activities that they employed to support DEI-focused skills development, including case studies (86%), course texts (57%), and coursework on racial identity development (51%), which requires students to reflect on their background and how it has shaped their experience and perception of education and society. Directors also rated to what extent their programs exposed students to research by scholars of color (3.8) (see Table 12), with only around 30% indicating they did so “to a great extent.” Others shared activities they employ in open-ended questions. These include: equity audits; simulations; community walks; and a DEI-focused portfolio or thesis.
DEI-Focused Learning Activities Employed in NYS SBL Programs
Audits
Walks
Portfolio or Thesis
On active learning, program directors shared insights, paraphrased here:
- The power of community walks and projects engage families and stakeholders;
- The learning activity called “action research” brings marginalized and minoritized students into the sphere of success;
- In each course in the program, students must engage in a simulation with a trained actor, and many of the simulations are DEI-focused.
A few directors shared about intensive learning experiences available through their institution, such as:
- “Truth, Racial Healing, and Transformation Healing Circles” available on campus;
- Optional participation in social justice teach-ins and annual events on campus;
- Optional participation in the “National Day of Racial Healing” events on campus.
Generally, some program directors relayed that DEI-related instructional content and learning activities were a strong part of their educational leadership preparation programs.
Inclusive Practices
When it came to inclusive practices — skills development for competence and capacity in supporting individual student groups in schools — directors rated their programs lower (see Table 12). On the 5-point scale, in relation to various student groups, directors ratings included:
A moderate focus on students with disabilities (SWDs) (4.0 out of 5)
- Less focus on ELLs (3.6)
- Less focus on LGBTQ+ students (3.6)
- Far less focus on indigenous students (3.0)
There were outliers to these lower ratings. A quarter of the directors rated their institutions’ programs in leadership development for supporting ELLs and SWDs as highly, or “to a great extent,” and around a sixth did the same for LGBTQ+ and indigenous student support. Rating their programs’ integration of DEI practices and content and its assessment of DEI skills, directors rated their programs, on average, just above “to a moderate extent.” Other categories reflected positive ratings, as well, such as:
- The extent to which the program develops students’ leadership capacity to support DEI goals;
- The program’s emphasis on continuous improvement (4.87); 91% of directors rating “to a great extent”;
- The program’s teaching of how to support and develop culturally relevant, coherent systems of curriculum and instruction; all programs with strong ratings — 89% of directors rating “to a great extent.”
Overall, directors rated their programs positively in preparing aspiring leaders for DEI-integrated curriculum and instruction and broad school goals, but lower in addressing leadership capacity to support individual student groups in schools.
Alignment with PSEL Standards and CR-SE Framework
We compared the directors’ Program Features Survey ratings to the Professional Standards for Educational Leadership (PSEL) and the NYS Culturally Responsive-Sustaining Education Framework (CR-SE) to evaluate alignment. We found that directors ratings reflected meeting four PSEL standards highly. Those standards are:
- Standard 3: Equity and Cultural Responsiveness
- Standard 4: Curriculum, Instruction and Assessment
- Standard 5: Community of Care for Students
- Standard 6: Professional Capacity of School Personnel
These standards correlate to four CR-SE principles — also reflecting high alignment. Those are:
- Welcoming and Affirming Environment
- Inclusive Curriculum and Assessment
- High Expectations and Rigorous Instruction
- Ongoing Professional Learning
Though alignment ratings were generally high, Table 12 shows the exception — lower ratings in programs’ skills development for supporting specific student groups. This growth area is reflected in the 3.0–4.0 mean rating related to PSEL 5, “Community of Care for Students” and the CR-SE’s “Welcome and Affirming Environment” principle.
| PSEL Standards | CR-SE Framework | Survey Items | Mean Rating |
|---|---|---|---|
| Standard 3: Equity and Cultural Responsiveness | Welcoming and Affirming Environment | Strive for equity | 4.9 |
| Standard 3: Equity and Cultural Responsiveness | Inclusive Curriculum and Assessment | Integrate DEI throughout | 4.5 |
| Standard 4: Curriculum, Instruction and Assessment | High Expectations and Rigorous Instruction | Develop coherent systems of curriculum and instruction | 4.9 |
| Standard 5: Community of Care for Students | Welcoming and Affirming Environment | Support students | 3.0–4.0 |
| Standard 6: Professional Capacity of School Personnel | Ongoing Professional Learning | Develop professional capacity of staff | 4.8 |
Recruitment Practices
We inquired about how programs approach practices to recruit a diverse student body. While many directors shared commonplace recruitment practices, such as attending university recruitment events (50%) and doing social media outreach (48%), many also shared targeted strategies. Those include:
- Collaborating with local school districts (60%);
- Targeting professional organizations (30%), such as the Long Island Latino Teachers Association or the Long Island Black Educators Association;
- Offering scholarships to students from diverse backgrounds (15%).
Quotes from Program Directors on Recruiting a Diverse Student Body
- “[G]iven where [our institution] is situated, recruitment efforts are concentrated in the Bronx, and we typically attract Black, Latinx, and AAPI students, many of whom grew up in and work in the Bronx, along with a few white students.”
- “We have a scholarship for emerging leaders of color that we give out once a year to all students of color in our program.”
Landscape of Diversity In the Aspiring Leader Pool
In surveying directors about the racial and gender makeup of their institutions’ program cohort, as well as the percentage of students residing in urban settings, we found the following averages across the state:
- 60% of students are white;
- 19% of students are African American;
- 14% of students are Hispanic;
- 2% of students are Asian American;
- 3% of students are listed as representing a race other than the four listed above;
- 72% of students are female (see Table 9);
- 43% of students reside in urban settings (see Table 9).
The latter two statistics on gender makeup and percentage of students residing in urban settings are fairly comparable across public and private institutions. These average percentages vary widely by region. NYC and Lower Hudson Valley have the lowest average percentage of students who are white; Western New York has the highest. In NYC institutions, nearly 79% of educational leadership students are female, in contrast with 65–71% in other regions. Naturally, almost all students in NYC institutions’ programs live in an urban setting (88%), in contrast with 17–18% of students at institutions in Upstate New York and on Long Island.
Relationally, we found no statistically significant relationship between DEI-related program content and practices and student demographics or program attributes such as tuition rate or number of credits.
Discussion of Findings: Trends and Patterns in SBL Leadership Preparation in NYS
Our tabulations on educational leadership preparation in NYS and the nature of program content, structure, and delivery are full of rich findings. Patterns emerged that raise important questions about sustainability, access, and quality in the state’s educational leadership preparation landscape. Though regional differences remain, these broad patterns hold relatively steady across the state. A main concern is that increased program competition may be driving design and delivery, evidenced by:
- Program closures;
- Reduced opportunities for in-person learning;
- Lower credit requirements;
- A reliance on adjunct faculty.
Trends in the data reveal details within each of these patterns. For instance, looking at the long-term sustainability of the field, we see that the overall number of programs in NYS institutions has declined. Program closures have been mainly at private institutions in the NYC metropolitan area; while the majority of the state’s programs are still concentrated in that region, this trend must be monitored over time.
Turning to access concerns, we note a pattern in graduation numbers by region. Specifically, Long Island institutions produce the most graduates — defined as aspiring school leaders awarded postgraduate certificates or master’s degrees — while Upstate and Western New York produce the fewest. This trend suggests a geographic barrier to educational leadership preparation access. While it’s possible that online instructional modalities may mitigate this issue, the modality in and of itself raises questions around quality, as data trends show reduced opportunities for in-person learning across the state.
Pairing this modality trend with what the data shows is an increased reliance on adjunct faculty, it seems that large cohorts of aspiring school leaders may now be educated primarily by adjuncts online. Surprisingly, programs with more adjunct faculty and higher tuition graduated more students on average.
Lastly, on quality, data trends reveal that credit requirements differ across regions and institution types. Long Island programs require the fewest credits and produce the most graduates across the state’s regions. Private institutions require fewer credits than their public counterparts, seemingly to offset higher tuition costs. Taking these patterns and trends as a broad view of what’s happening in the field, it’s clear that monitoring over the coming decade is essential to ensure sustainability, fair access, and quality of instruction and student experience.
Patterns and Trends: Leadership Preparation in DEI Practices
Continuing, the latter portion of this research project concerned itself with how programs are preparing aspiring school leaders to competently deliver on diversity, equity, and inclusion (DEI) practices in schools. Our analysis reveals both encouraging practices and notable disparities.
Encouraging Practices
- Most programs integrate social justice explicitly throughout all coursework and internship experience;
- High ratings on preparing leaders to support students with disabilities;
- Adoption of PSEL and CR-SE framework;
- Experiential approaches are not universal but may provide powerful models for engaging students in active, practice-based DEI exploration.
Notable Disparities
- Less than one-third of programs (32%) require a dedicated DEI or social justice course;
- The extent of DEI coverage is uneven across regions;
- There are persistent gaps when considering developing leadership to support specific student populations, particularly ELLs, Indigenous students, and LGBTQ+ groups;
- Instructional practices vary widely across programs.
Most institutions’ programs, regardless of having a dedicated course, integrate social justice explicitly throughout all coursework and internship experience. The regional differences suggest that, although most programs strive to address DEI, the extent of coverage is uneven. Importantly, program directors reported their strongest emphasis on broad principles—striving for equity, developing professional capacity, and cultivating cultural competence. In these areas, program ratings were consistently high, with nearly all directors reporting moderate to extensive integration of these across coursework.
At the same time, findings reveal persistent gaps when considering developing leadership to support specific student populations. While programs rated themselves highly in preparing leaders to support students with disabilities, average scores dropped when considering English Language Learners and LGBTQ+ students, and fell even further for Indigenous students. This discrepancy highlights a tension between a strong general commitment to equity and a lack of depth in preparing leaders for the diverse realities of particular student groups.
Instructional practices also varied widely across programs. The majority used DEI-focused case studies and texts, and about half incorporated identity development courses. Fewer programs reported experiential or community-based practices such as equity audits, simulations, community walks, or thesis projects focused on equity. Some directors, however, described innovative practices, such as simulations with trained actors or participation in campus-based racial healing initiatives. These practices suggest that while experiential approaches are not universal, they may provide powerful models for engaging students in active, practice-based learning about DEI.
Recruitment efforts further demonstrate the ways in which institutional context shapes DEI commitments. Most programs recruited primarily from local school districts, with some drawing on professional associations or offering targeted scholarships for aspiring leaders of color. Private institutions appeared somewhat more proactive in these targeted efforts. Student demographics varied significantly by region: while New York City and the Lower Hudson Valley reported lower proportions of White students and higher proportions of students of color, programs in Western New York reported the highest percentages of White enrollment. Female students represented a large majority overall with their concentration especially high in New York City programs, raising concern about the inclusion of male aspiring leaders of color.
Taken together, these findings point to a system that has made substantial progress in weaving DEI principles into leadership preparation but still demonstrates unevenness across regions, sectors, and student groups. Institutions’ programs are fairly well aligned with state standards and frameworks, but weaker ratings for supporting English Language Learners, Indigenous students, and LGBTQ+ students highlight areas where programs fall short on building welcoming and affirming environments. Ultimately, these findings underscore both the promise and the challenge of preparing equity-focused school leaders in New York. Programs have broadly embraced the need for DEI integration, but differences remain by region and by institution type.
Implications and Recommendations
This report was prepared at the same time as the state was revamping its certification requirements, leading to changes in leadership preparation program registration requirements. While the findings shared here provide useful implications for program and state policy, a follow-up study of institutions and their programs would be warranted to learn about the program delivery impact of the recent licensure changes.
Recommendations for State Policy
Our findings suggest that a re-investment in and monitoring of program quality is important to the future of the field. Now, with consideration to new state licensure requirements combining building and district leadership preparation, it’s ever more essential. While the state requires alignment to national leadership standards, we question the following:
- Whether quality preparation can be fostered and sustained in fully asynchronous programs, where students never meet;
- Whether programs requiring fewer than 30 credits can prepare candidates to meet standards and be effectively ready for initial roles in both building and district leadership;
- Whether a fully adjunct-staffed program can:
- Sufficiently develop and sustain coherent, high-quality instruction;
- Recruit diverse candidates for admissions;
- Monitor program outcomes;
- Stay current with research and field priorities;
- Coordinate and integrate program components, student feedback, and field relations.
Therefore, we recommend that the state set expectations for program quality in support of the national standards and establish parameters for program delivery, particularly the number of credits, adjunct/faculty ratios, and asynchronous/synchronous and face-to-face contact time ratios.
We also recommend that the state work with national accreditation agencies (such as AAQEP and CAEP) to establish recommended adjunct/faculty ratios, as exists for other professions, such as counseling.
To reduce competition and its unintended effects on program quality and to stabilize the field, we recommend that the state establish a moratorium on approving new educational leadership preparation programs.
Given the state’s strong stance on DEI and the CR-SE framework for schools and districts, we expected a stronger emphasis on DEI-related leadership preparation than we found in our survey results. We recommend that the state add a program requirement to demonstrate how they are preparing leaders to implement the CR-SE framework and assess candidates’ DEI proficiency in coursework and field work.
To increase diversity among candidates in the leadership pipeline, we recommend that the state provide scholarships and other funding opportunities to support candidates and programs in their diversity efforts.
Recommendations for Program Policy
Our analysis of program structure suggests that programs are struggling to balance credits, modality, staffing, and tuition costs to maintain competitive enrollments. We are concerned that this is yielding shortened preparation experiences, high adjunct/faculty ratios, and no in-person student contact.
With the new state licensure policy, programs must now expand the scope of their preparation to encompass preparation for both building and district leadership readiness. Such necessity competes with these structural considerations and may lead to higher adjunct/faculty ratios, more asynchronous coursework, and more superficial coverage of leadership standards. The added competition for students, particularly in the greater NYC area, may drive institutions to reduce credit requirements, resulting in a superficial coverage of the new state requirements, yielding more poorly prepared leaders.
As such, we recommend that programs rethink their asynchronous/synchronous and face-to-face balance and evaluate the impact of fully asynchronous programs on measures of candidate readiness, such as through the NYS leadership exams and candidates’ post program career advancement.
Lastly, looking beyond the scope of our research to new topics, we are concerned with the expanded use of generative AI tools such as ChatGPT, that students may not be producing authentic work products. While not addressed in our survey, we are concerned about the potential abuse, particularly for students in asynchronous-only programs. We recommend that institutions and their programs examine how to increase face-to-face interactions and assessments to curb potential abuse and improve the quality of preparation.
References
- Baum, S., & Steele, P. (2018). The price of graduate and professional school: How much students pay. AccessLex Institute–Funded Research, 12.
- National Policy Board for Educational Administration. (2015). Professional standards for educational leaders 2015. Retrieved August 16, 2025, from https://www.wallacefoundation.org/sites/default/files/2023-09/Professional-Standards-for-Educational-Leaders-2015.pdf
- New York State Education Department. (n.d.). Culturally responsive-sustaining education framework. Retrieved August 16, 2025, from https://www.nysed.gov/crs/framework
- Radd, S. I., Generett, G. G., Gooden, M. A., & Theoharis, G. (2021). Five practices for equity-focused school leadership. ASCD.
- Fuller, E. J., & Young, M. D. (2022). Challenges and opportunities in diversifying the leadership pipeline: Flow, leaks, and interventions. Leadership & Policy in Schools, 21(1), 19–34. https://doi.org/10.1080/15700763.2021.2022712
- Koonce, G. (2009). Accreditation: A standards-based model for aligning learning outcomes in a master’s degree educational leadership preparation program. International Journal of Educational Leadership Preparation, 4(3). https://research.ebsco.com/linkprocessor/plink?id=2492d7ff-b077-3b7f-9b57-65c7d1289438
- Pavlakis, A., & Kelley, C. (2016). Accreditation in the professions: Implications for educational leadership preparation programs. Journal of Research on Leadership Education, 11(1), 68–90. https://doi.org/10.1177/1942775116641663
- Perrone, F., & Tucker, P. D. (2019). Shifting profile of leadership preparation programs in the 21st century. Educational Administration Quarterly, 55(2), 253–295.
- Reyes-Guerra, D., Barakat, M., & Maslin-Ostrowski, P. (2022). Developing a more diversified school leadership pipeline: Recruitment, selection, and admission through an innovative university–district partnership. Leadership & Policy in Schools, 21(1), 48–63.
- Scott, D. (2018). 50-state comparison: School leader certification and preparation programs.
- Steele, J. L., Steiner, E. D., & Hamilton, L. S. (2021). Priming the leadership pipeline: School performance and climate under an urban school leadership residency program. Educational Administration Quarterly, 57(2), 221–256.
Appendix
| Institution | IPEDS Category* | Post-graduate Certificate | Master's Degree |
|---|---|---|---|
| Adelphi University | Educational Leadership and Administration, General/Educational, Instructional, and Curriculum Supervision (distance) | 8 | 0 |
| Bank Street College of Education | Educational Leadership and Administration, General. Instructional, and Curriculum Supervision | 6 | 124 |
| SUNY Binghamton | Educational Leadership and Administration, General | 18 | 0 |
| CUNY Brooklyn College | Educational Leadership and Administration, General | 0 | 30 |
| Canisius College | Educational Administration and Supervision, Other/ Educational, Instructional, and Curriculum Supervision | 10 | 6 |
| CUNY City College | Educational Leadership and Administration, General | 17 | 4 |
| Fordham University | Educational Leadership and Administration, General | 5 | 22 |
| Hofstra University | Educational Leadership and Administration, General | 14 | 1 |
| CUNY Hunter College | Superintendency and Educational System Administration | — | — |
| CUNY Lehman College | Educational Leadership and Administration, General | 10 | 15 |
| Le Moyne College | Educational Leadership and Administration, General | 25 | 25 |
| Long Island University Post | Educational Leadership and Administration, General (all programs marked as distance) | 77 | 39 |
| Manhattanville University | Educational Leadership and Administration, General/Educational, Instructional, and Curriculum Supervision | 16 | 3 |
| Mercy University | Educational Administration and Supervision, Other/Educational, Instructional, and Curriculum Supervision | 0 | 19 |
| Molloy University | Educational Leadership and Administration, General | 93 | 0 |
| Niagara University | Educational Administration and Supervision, Other | 5 | 25 |
| CUNY Queens College | Educational Leadership and Administration, General | 1 | 16 |
| Russell Sage College | — | 0 | 0 |
| St Bonaventure University | Educational Leadership and Administration, General | 14 | 2 |
| St. John Fisher University | Educational Leadership and Administration, General | 0 | 7 |
| St. John's University | Educational, Instructional, and Curriculum Supervision | 22 | 16 |
| St. Joseph's University (registered in BK) | Educational Leadership and Administration, General | 2 | 2 |
| Stony Brook University | Educational Leadership and Administration, General | 165 | 0 |
| SUNY New Paltz | Elementary and Middle School Administration/Principalship | 57 | 0 |
| SUNY Brockport | Educational Leadership and Administration, General | 0 | 4 |
| SUNY Cortland | Educational Leadership and Administration, General | 32 | 0 |
| SUNY Fredonia | Educational Administration and Supervision, Other | 13 | 0 |
| SUNY Oswego | Educational Leadership and Administration, General | 45 | 0 |
| SUNY Plattsburgh | Elementary and Middle School Administration/Principalship/ Educational, Instructional and Curriculum Supervision | 25 | 0 |
| SUNY Potsdam | Educational Leadership and Administration, General | 14 | 0 |
| Syracuse University | Educational Leadership and Administration, General | 24 | 0 |
| The College of Staten Island | Educational Leadership and Administration, General | 15 | 0 |
| Touro University | Educational Leadership and Administration, General | 0 | 43 |
| University at Albany | Educational Leadership and Administration, General | 0 | 6 |
| University at Buffalo | Educational Leadership and Administration, General | 0 | 5 |
| Teachers College, Columbia University | Educational Leadership and Administration, General | 0 | 139 |
| Buffalo State University | Educational Leadership and Administration, General | 11 | 0 |
*IPEDS Category Key
- Educational Leadership and Administration, General
- 1
- Educational, Instructional, and Curriculum Supervision
- 2
- Other / Educational, Instructional, and Curriculum Supervision
- 3
- Educational Administration and Supervision
- 4
- Superintendency and Educational System Administration
- 5
- Educational Leadership and Administration, General (Distance)
- 6
- Educational Administration and Supervision, Other
- 7
- Elementary and Middle School Administration / Principalship
- 8